IELTS Writing Task 1 ตัวอย่างโจทย์
▶ ตัวอย่างข้อสอบ IELTS Writing Task 1◀
รายละเอียดของ IELTS Writing Task 1
- เป็นข้อสอบเขียนบรรยายข้อมูลที่โจทย์ให้มา โดยมีหลากหลายรูปแบบเช่นกราฟ แผนภาพ ตารางข้อมูล เป็นต้น
- ต้องเขียนอย่างน้อย 150 words
- เขียนในลักษณะ report รายงานข้อมูลจากสิ่งที่เห็น
- ควรใช้เวลากับ Task 1 ไม่เกิน 20 นาที (อีก 40 นาที ควรไปใช้กับ Task 2)
▶ ข้อสอบ IELTS Writing Task 1: แบบ Table
You should spend about 20 minutes on this task.
The table below shows social and economic indicators for four countries in 1994, according to United Nations statistics.
Summarise the information by selecting and reporting the main features, and make comparisons where relevant.
Write at least 150 words.
|
Indicators |
Canada |
Japan |
Peru |
Zaire |
|
Annual income per person (in $US) |
11,100 |
15,760 |
160 |
130 |
|
Life expectancy at birth |
76 |
78 |
51 |
47 |
|
Daily calorie supply per person |
3,326 |
2,846 |
1,927 |
1,749 |
|
Adult literacy rate (%) |
99 |
99 |
68 |
34 |
โจทย์แบบตารางข้อมูลนั้น อาจจะดูน่าตกใจเพราะมักจะมีตัวเลขเยอะ แต่ถ้ามีเทคนิคในการจับจุดข้อมูล ดึงเฉพาะจุดที่สำคัญ และเป็น feature เด่น ๆ มาเขียน ก็สามารถเขียนตอบได้ทันเวลาค่ะ โดยที่เราไม่จำเป็นต้องลงรายละเอียด เขียนถึงข้อมูลทุกจุดค่ะ อย่างเช่นในตารางนี้ หากมองภาพรวม จะเจอข้อมูลที่เด่น ๆ คือ
1) Annual income ของ Japan สูงสุด ในขณะที่ของ Zaire ต่ำสุดจาก 4 ประเทศ
2) อัตราการรู้หนังสือในผู้ใหญ่ของ Canada และ Japan สูงเมื่อเทียบกับ Peru และ Zaire
เนื่องจากเราควรใช้เวลาแค่ประมาณ 20 นาทีใน Task 1 ดังนั้นควรดึงเอาเฉพาะข้อมูลที่สำคัญจริง ๆ มาเขียน แต่อาจะเสริมด้วยการเขียนบรรยายเปรียบเทียบระหว่างข้อมูลเข้าไปด้วยก็ได้ค่ะ
✧✧✧✧✧
▶ ข้อสอบ IELTS Writing Task 1 : แบบ Bar Graph
You should spend about 20 minutes on this task.
The chart below shows average prices per kilometre of clothing imported into the European Union from six different countries in 1993 and 2003 are shown in the bar chart below.
Summarize the information by selecting and reporting the main features, and make comparisons where relevant.
You should write at least 150 words.

✧✧✧✧✧
▶ ข้อสอบ IELTS Writing Task 1 แบบ Bar Graph + Table
You should spend about 20 minutes on this task.
The chart below shows the value of one country's exports in various categories during 2015 and 2016. The table shows the percentage change in each category or exports in 2016 compared with 2015.
Summarize the information by selecting and reporting the main features, and make comparisons where relevant.
You should write at least 150 words.

✧✧✧✧✧
▶ ข้อสอบ IELTS Writing Task 1 แบบ Pie Charts
You should spend about 20 minutes on this task.
The pie charts below show the online shopping sales for retail sectors in Australia in 2010 and 2015.
Summarize the information by selecting and reporting the main features, and make comparisons where relevant.
You should write at least 150 words.


✧✧✧✧✧
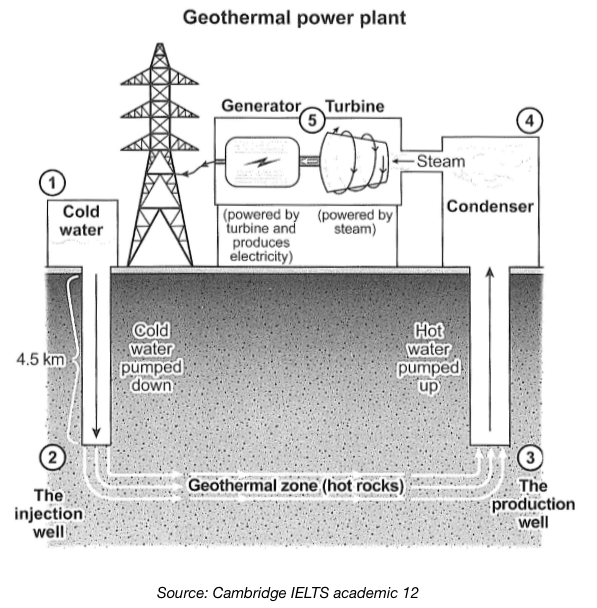
▶ ข้อสอบ IELTS Writing Task 1 แบบ Diagram
You should spend about 20 minutes on this task.
The diagram below shows how geothermal energy is used to produce electricity.
Summarise the information by selecting and reporting the main features, and make comparisons where relevant.
You should write at least 150 words.
IELTS Writing ถือว่าเป็นข้อสอบที่ยาก! ถ้าไม่มีเทคนิคในการดูข้อมูล วางแผนการเขียน
ยิ่งถ้าพื้นฐานภาษาไม่แน่นพอ ก็ยิ่งเป็นสาเหตุให้คะแนนออกมาไม่เป็นไปตามเป้า!
★ มาติวกับกับคอร์ส IELTS 4 Skills กับครูเจี๊ยบเถอะค่ะ ★

- เก็บครบทุกเนื้อหา ทุกรูปแบบโจทย์ที่ต้องเจอในข้อสอบ
- วางแผนการเขียน รูปแบบ patterns ช่วยอัปคะแนน
- สอนจากโจทย์ เจาะลึกวิธีการเขียนทุกแบบ
- มีการบ้านในคอร์สใก้ลองเขียน ส่งประเมิน Band เหมือนจริง
- ติวครบ 4 สกิล เจาะลึกทุกเทคนิคเอาตัวรอด อัปคะแนนได้ชัวร์!
✅ เก่งศัพท์ IELTS อัป Band 7.0+ ต้องเซ็ทนี้ ✅

สอบถามคอร์สเรียนและโปรโมชั่น
โทร : 098-281-3164


คอร์สเรียน IELTS ออนไลน์ ติวสอบ IELTS ครบ 4 ทักษะ (Listening/Reading/Writing/Speaking)
คอร์สเรียน IELTS ออนไลน์ Kru Jeab IELTS 4 Skills
ติว Grammar ครบ! เพื่อการสอบ กับครูเจี๊ยบประสบการณ์ติวกว่า 25 ปี